Case Study Overview
Objective
Analyze the production capacity of a French bread production line using Time and Motion Engineering. Determine the number of required timings, normal and standard times, and calculate daily and weekly capacity. Identify and address customer complaints by applying the Ishikawa Diagram to find root causes and propose corrective actions for quality improvement.
Challenge
The bakery faces challenges in meeting customer demand for French bread due to production bottlenecks and quality inconsistencies. This impacts customer satisfaction and limits growth potential. The challenge is to optimize the production process to increase capacity while simultaneously improving and maintaining consistent product quality to minimize customer complaints. This requires a systematic approach using Time and Motion Engineering principles and quality management tools like the Ishikawa diagram.
Context
An industrial bakery, operating in the market for 37 years, is undergoing a management change. The founders, João and Maria, have decided to pass the administration to their children, Pedro and Marina.
Pedro is an Administrator and will take over the administrative processes, while Marina, a Production Engineer, will be responsible for the industrial processes.
The factory's structure consists of 20 employees, including:
- 1 Production Manager
- 1 Production Supervisor
- 3 PCP Analysts
- 4 Bakers
- 4 Production Assistants
- 2 Cleaners
- 1 Maintenance Supervisor
- 1 Maintenance Technician
- 1 Quality Supervisor
- 2 Quality Assistants
The main goal of the successors is to expand the market. However, they first intend to ensure the fulfillment of local demand and customer base by producing high-quality and hygienic items with the help of new industrial equipment and promoting teamwork.
At the beginning of their management, the siblings noticed that some orders were not being fulfilled due to product unavailability, including French bread, which is the most sought-after product.
Using her expertise, Marina held a meeting with the production team and decided to apply the concepts of Time and Motion Engineering to determine the actual capacity of the French bread production line.
Production Process Information
The production begins with the separation of ingredients, which are added to the mixer before turning on the equipment. After that, the dough goes through the softening process, performed by rollers. Then, 1.4 kg of dough is weighed for cutting and subsequently taken to the shaping process. After shaping, batches of 25 units are placed in a mold to wait for the fermentation process. In this analysis, the timing does not consider the fermentation and baking operations, as the bread must rest for 16 hours overnight and is baked the next morning. Since fermentation occurs outside working hours, it is disregarded in the calculation of production capacity. After fermentation, the bread is taken to the oven for 20 minutes at 210°C.
Table 1 presents the timing data for the production process operations, considering only the timing up to the shaping process. Five preliminary timings were performed for each activity.
Table 1 - Operation Timing
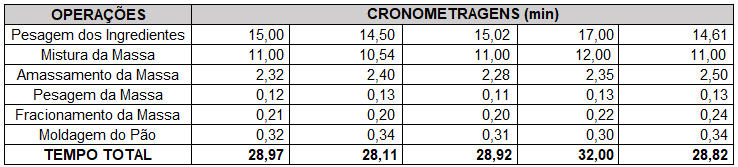
Important considerations for the study:
- Ingredients: Wheat flour, bread yeast, margarine, salt, and sugar;
- Average bread weight: 56 grams;
- Work schedule: 8 hours per day;
- Production: 7 days a week;
- Standard time with 95% probability and a relative error of 5%;
- Standard rhythm: 105%;
- Permissive time: 20 minutes for personal needs and 10 minutes for fatigue;
- Variables:
Based on the context and the concepts of Time and Motion Engineering, determine:
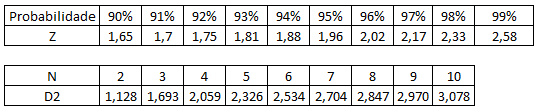
- Number of timings.
- 95% confidence interval = \( Z = 1.96 \)
- Relative error \( E_r = 5\% \)
- Standard deviation \( r = 32 - 28.11 = 3.89 \)
- \( D_2 = 2.326 \) (considering \( N = 5 \) timings)
- Mean of times \( \bar{x} = 29.364 \)
- Normal time of activities.
- Obtain observed time (TO) as average of timed measurements
- Multiply TO by 105% pace rate
- Total normal time (TN) = 30.83 minutes
- Standard time of activities.
- Add allowance to existing TN
- Total allowance: 30 minutes in an 8-hour workday (480 minutes)
- Calculate allowance percentage: \[ p = \frac{30 \times 100}{480} = 6.25\% \]
- Apply allowance formula: \[ FT = \frac{1}{1 - 0.0625} = 1.06667 \ (\text{rounded to } 1.067) \]
- Multiply TN by FT to obtain TP = 32.89 minutes
- Daily and weekly capacity.
- Mean bread weight = 56g
- Dough batch = 1400g
- Quantity per batch (\( Q \)) = \( \frac{1400}{56} = 25 \) units
- Daily work time (\( T_{\text{available}} \)) = 480 min
- Standard time (\( TP \)) = 32.89 min
- Unit standard time (\( TP_{\text{unit}} \)) = \( \frac{32.89}{25} = 1.3156 \)
Considering the information provided in the statement:
Statistical formula for sample size:
\( \eta = \left( \frac{Z \cdot r}{E_r \cdot D_2 \cdot \bar{x}} \right)^2 \)
Substituting values:
\( \eta = \left( \frac{1.96 \cdot 3.89}{0.05 \cdot 2.326 \cdot 29.364} \right)^2 = \left( \frac{7.6244}{3.4150332} \right)^2 = (2.23259909)^2 = 4.98 \approx 5 \)
Steps:
| Operations | T1 | T2 | T3 | T4 | T5 | TO | TN |
|---|---|---|---|---|---|---|---|
| Preparation | 15.00 | 14.50 | 15.02 | 17.00 | 14.61 | 15.23 | 15.23 × 1.05 = 15.99 |
| Mixing | 11.00 | 10.54 | 11.00 | 12.00 | 11.00 | 11.11 | 11.11 × 1.05 = 11.66 |
| Kneading | 2.32 | 2.40 | 2.28 | 2.35 | 2.50 | 2.37 | 2.37 × 1.05 = 2.49 |
| Weighing | 0.12 | 0.13 | 0.11 | 0.13 | 0.13 | 012 | 0.12 × 1.05 = 0.13 |
| Dividing | 0.21 | 0.20 | 0.20 | 0.22 | 0.24 | 0.21 | 0.21 × 1.05 = 0.22 |
| Moulding | 0.32 | 0.34 | 0.31 | 0.30 | 0.34 | 0.32 | 0.32 × 1.05 = 0.34 |
| Total | 28.97 | 28.11 | 28.92 | 32.00 | 28.82 | 29.36 | 29.36 × 1.05 = 30.83 |
Steps:
| Operations | T1 | T2 | T3 | T4 | T5 | TO | TN | TP |
|---|---|---|---|---|---|---|---|---|
| Preparation | 15.00 | 14.50 | 15.02 | 17.00 | 14.61 | 15.23 | 15.99 | 15.99 × 1.067 = 17.05 |
| Mixing | 11.00 | 10.54 | 11.00 | 12.00 | 11.00 | 11.11 | 11.66 | 11.66 × 1.067 = 12.44 |
| Kneading | 2.32 | 2.40 | 2.28 | 2.35 | 2.50 | 2.37 | 2.49 | 2.49 × 1.067 = 2.65 |
| Weighing | 0.12 | 0.13 | 0.11 | 0.13 | 0.13 | 0.12 | 0.13 | 0.13 × 1.067 = 0.14 |
| Dividing | 0.21 | 0.20 | 0.20 | 0.22 | 0.24 | 0.21 | 0.22 | 0.22 × 1.067 = 0.24 |
| Moulding | 0.32 | 0.34 | 0.31 | 0.30 | 0.34 | 0.32 | 0.34 | 0.34 × 1.067 = 0.36 |
| Total Time | 28.97 | 28.11 | 28.92 | 32.00 | 28.82 | 29.36 | 30.83 | 30.83 × 1.067 = 32.89 |
Voice of the customers
While the studies were being conducted, Pedro called the production and quality team for an extraordinary meeting focused on product quality, as they had already received 5 complaints from different customers in the first half of the month, summarized below:
- Complaint 1: Bread with a bitter taste.
- Complaint 2: Presence of a fly in the bread.
- Complaint 3: Bread with a moldy smell.
- Complaint 4: Presence of grease.
- Complaint 5: Bread crumbling.
After presenting the complaints, Pedro said: "A bakery, like any other food establishment, needs to maintain high-quality standards to ensure customer satisfaction and food safety. Various problems can arise, affecting both product quality and business operations." He concluded by saying: "We have a problem."
- What name do you give to the problem related to customer complaints?
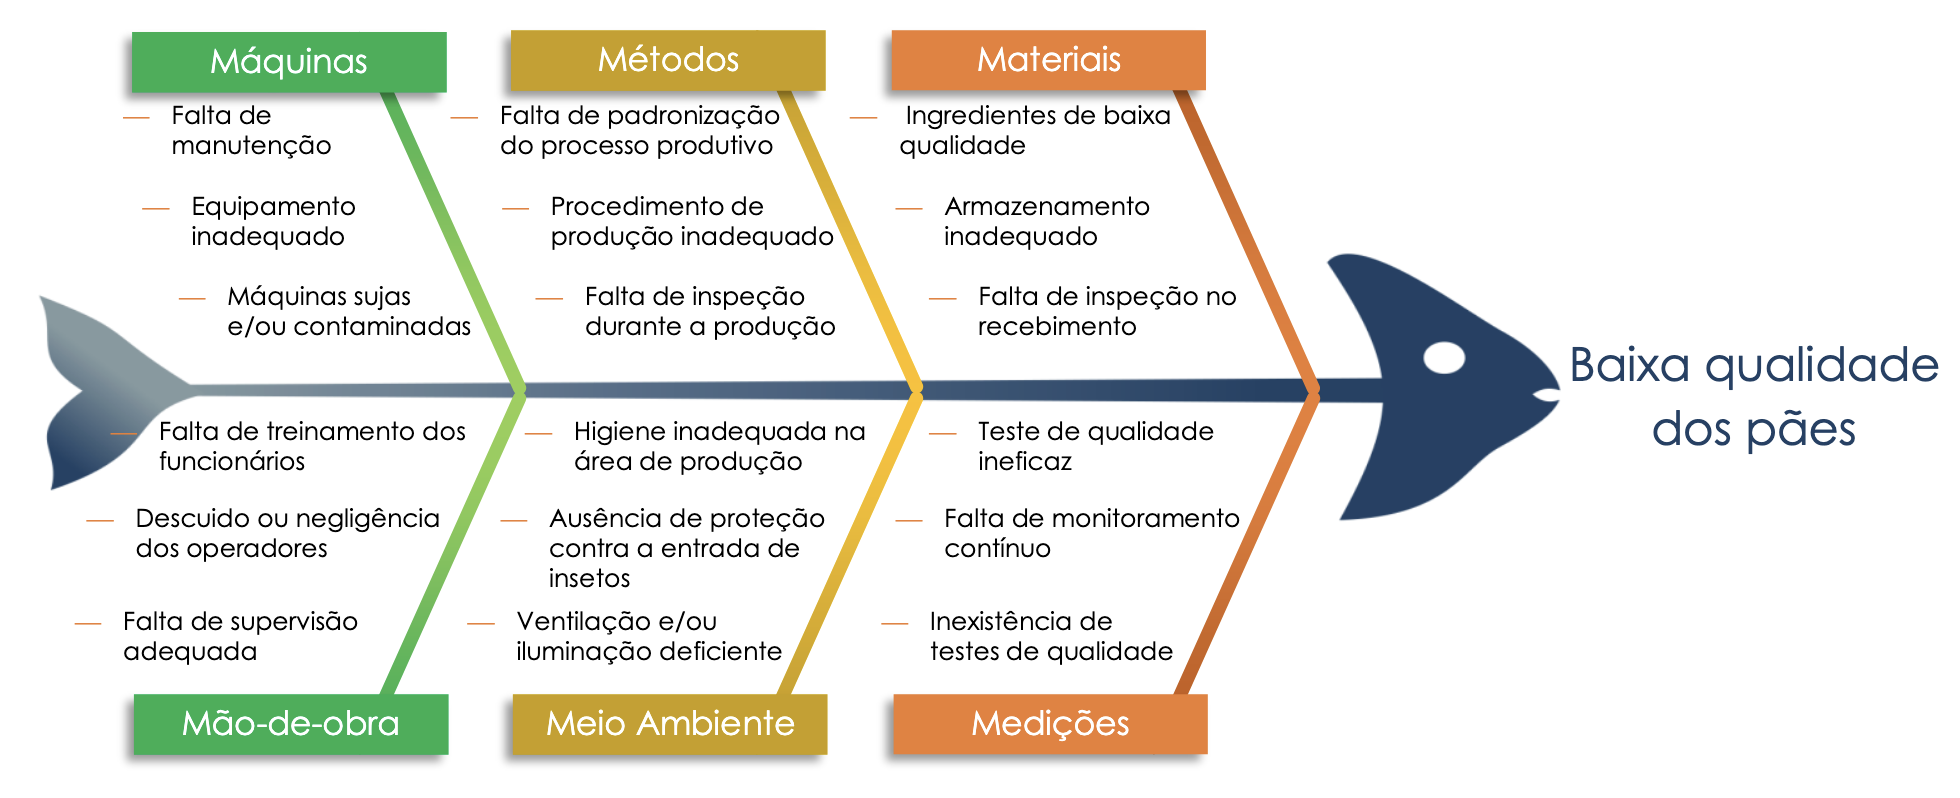
- Based on the problem defined in alternative "e," use the Ishikawa Diagram to relate the causes and effects of the problem.
- Machines
- Methods
- Materials
- Manpower
- Environment
- Measurements
There is clearly a quality deficiency in the product based on described issues.
To create an effective Ishikawa diagram, it requires participation from process stakeholders in brainstorming sessions. The diagram can be quite extensive, therefore for educational purposes I've limited myself to selecting just three potential causes for the quality issues in bread production.
The diagram is divided into six sections called 6Ms (as their titles start with these letters):
Potential causes for the main problem are discussed to identify root causes and create an action plan to mitigate them. Below is the diagram:
Key Findings & Industrial Implications
Production Capacity and Efficiency
- Current daily production capacity: ~365 loaves
- Current weekly production capacity: ~2554 loaves
- Identified potential improvements in mixing and kneading stages
- Potential for increased throughput through process optimization
- Data-driven baseline for future capacity planning and expansion
- Opportunities for streamlining weighing and dividing processes
Quality Issue Analysis and Corrective Actions
The Ishikawa diagram analysis revealed key areas of concern:
- Ingredient quality (Materials)
- Employee training and adherence to procedures (Manpower & Methods)
- Equipment maintenance (Machines)
- Hygiene practices (Environment)
Potential corrective actions include:
- Stricter quality control for incoming ingredients
- Refresher training for bakers on techniques and hygiene
- Preventative maintenance schedules for equipment
- Enhanced cleaning and sanitation procedures