Case Study Overview
Objective
Analyze the mechanical properties of materials used in engineering applications by conducting tensile tests. Construct stress-strain graphs to determine key properties such as yield stress, ultimate stress, rupture stress, and modulus of elasticity. Compare different materials, including A36 carbon steel, 6AI-4V titanium alloy, and 6061 aluminum alloy, to assess their suitability for structural applications. Use the results to validate the design of a metal structure and support material selection decisions.
Challenge
The primary challenge in this analysis lies in ensuring accurate and consistent tensile testing across different materials, each with unique characteristics. Specific difficulties include maintaining precise strain measurements to within ±0.001 mm/mm, controlling the testing velocity to accurately detect the yield point, and ensuring proper specimen alignment to prevent eccentric loading during the test. Further complexity arises from differentiating between ductile and brittle fracture mechanisms, accurately calculating true stress-strain values versus engineering values, and accounting for necking effects when determining ultimate strength. Additional hurdles come from comparing materials with varying work-hardening behaviors and fracture characteristics, which complicates the analysis and interpretation of results.
Context
You have been hired by a design company that performs structural calculations for various applications. One of the tasks proposed in your new role is to validate the design of a metal structure used in events, and for this, you initially need to evaluate the mechanical properties of some types of materials to select the most suitable for such an application.
To perform this evaluation, you can conduct some tests on the materials, one of which is the tensile test.
Step 1
Initially, you analyzed the results of a test conducted by one of the suppliers. In the test, a steel specimen was used, with a diameter of 12.6 mm and a gauge length of 51 mm, which was subjected to a tensile test until rupture. The load and elongation data obtained during the test are shown in Table 1.
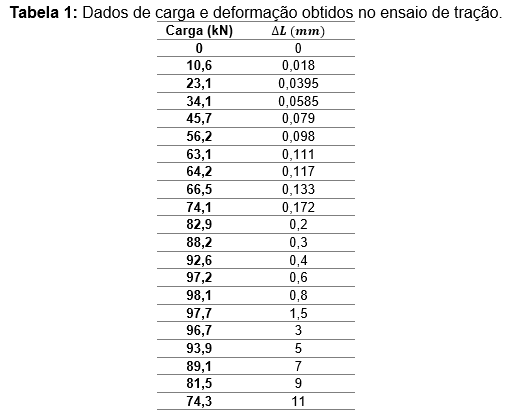
- Based on the results provided in Table 1, CONSTRUCT the stress-strain graph to identify each of the following items. EXPLAIN how you reached this conclusion for each item.
- The yield stress;
- The ultimate stress;
- The rupture stress.
- Yield Stress: Characterized by the beginning of the plastic region. Its value is approximately 707.355 MPa.
- Ultimate Stress: Defined as the highest stress reached by the material in the plastic zone. The increase in stress is caused by the reduction in the cross-sectional area of the material. The value of this stress is approximately 786.752 MPa.
- Rupture Stress: Expressed by the stress at the moment of rupture of the specimen. Its value is approximately 595.879 MPa.
- Proportional Limit: Defined by the point where the diagram ceases to exhibit linear behavior. Its value is approximately 506.056 MPa.
- Detrmine the modulus of elasticity of this material.
The normal stress is calculated by the following expression:
\[ \sigma = \frac{F}{A} \]Additionally, the strain is obtained from the following expression:
\[ \epsilon = \frac{|L_i - L_0|}{L_0} = \frac{\delta_0}{L_0} \]According to the problem statement, the following values of strain and normal stress were obtained:
| Load (kN) | δ (mm) | Strain (mm/mm) | Stress (MPa) |
|---|---|---|---|
| 0 | 0 | 0.0000 | 0.000 |
| 10.6 | 0.018 | 0.0004 | 85.011 |
| 23.1 | 0.0395 | 0.0008 | 185.260 |
| 34.1 | 0.0585 | 0.0011 | 273.479 |
| 45.7 | 0.079 | 0.0015 | 366.509 |
| 56.2 | 0.098 | 0.0019 | 450.718 |
| 63.1 | 0.111 | 0.0022 | 506.056 |
| 64.2 | 0.117 | 0.0023 | 514.878 |
| 66.5 | 0.133 | 0.0026 | 533.323 |
| 74.1 | 0.172 | 0.0034 | 594.275 |
| 82.9 | 0.2 | 0.0039 | 664.850 |
| 88.2 | 0.3 | 0.0059 | 707.355 |
| 92.6 | 0.4 | 0.0078 | 742.643 |
| 97.2 | 0.6 | 0.0118 | 779.534 |
| 98.1 | 0.8 | 0.0157 | 786.752 |
| 97.7 | 1.5 | 0.0294 | 783.544 |
| 96.7 | 3 | 0.0588 | 775.524 |
| 93.9 | 5 | 0.0980 | 753.069 |
| 89.1 | 7 | 0.1373 | 714.573 |
| 81.5 | 9 | 0.1765 | 653.622 |
| 74.3 | 11 | 0.2157 | 595.879 |
Therefore, I present the stress-strain diagram below:
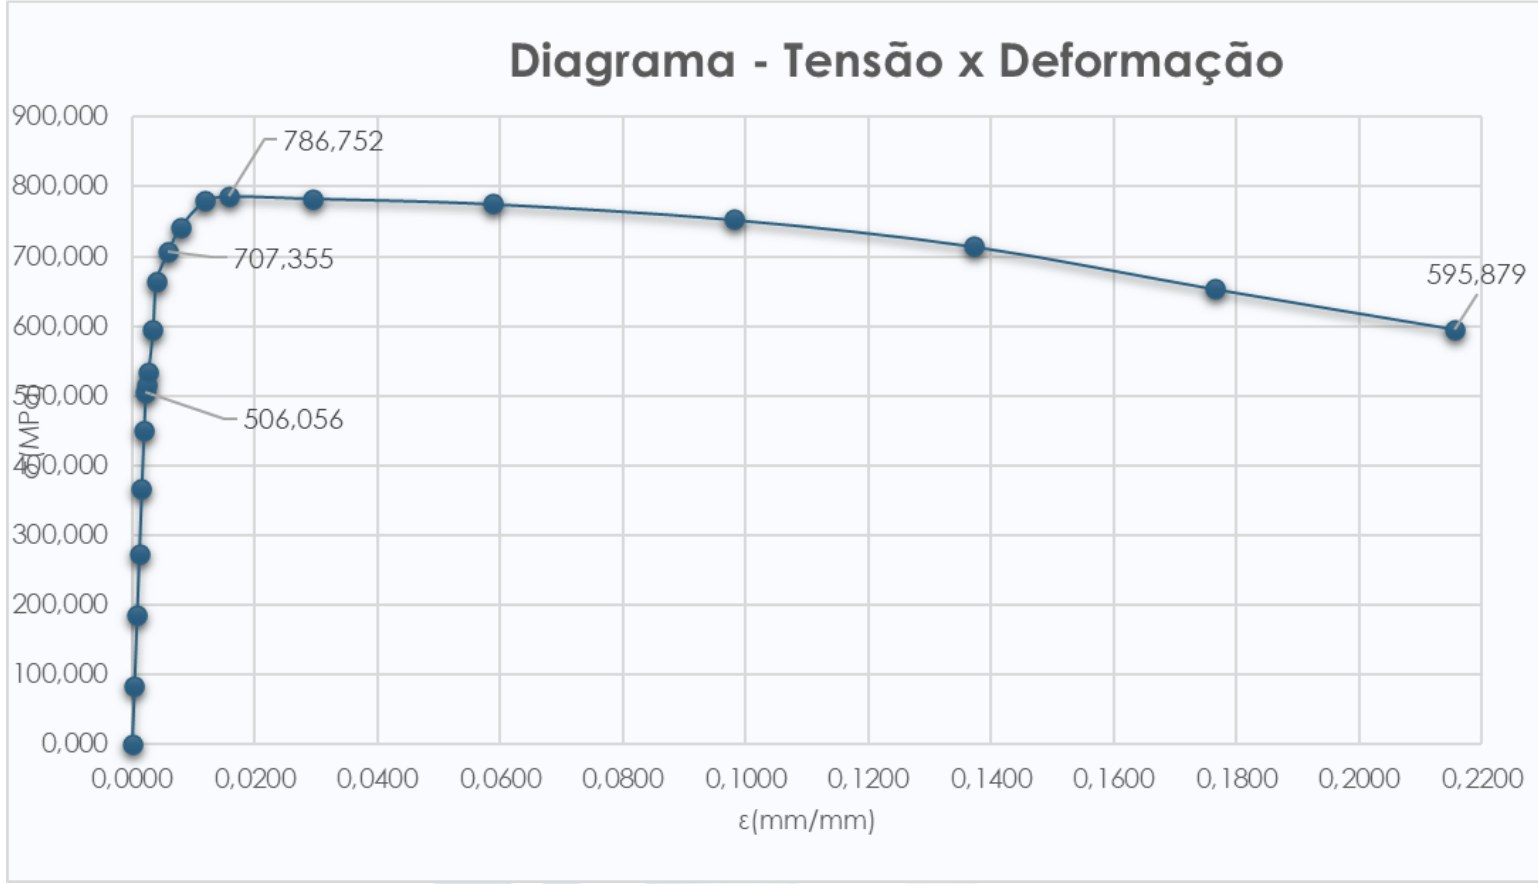
Analyzing the graph, the following observations are made:
Taking two points from the linear elastic region of the graph from the previous item, the modulus of elasticity is approximately:
\[ E = \frac{(\sigma_f - \sigma_0)}{(\epsilon_f - \epsilon_0)} \\ E = \frac{(273.479 - 185.260)}{(0.0011 - 0.0008)} \\ E = \frac{115.219}{0.0003} \\ E = 384063.3333 \, \text{MPa} \\ E = 384.063 \, \text{GPa} \]Step 2
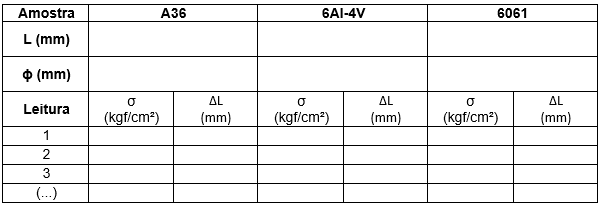
After evaluating the results, you decided to conduct tests with new materials from three other suppliers to compare the results. Each supplier provided a different material: A36 carbon steel, 6AI-4V titanium alloy, and 6061 aluminum alloy. In this case, you must perform the test for each material and evaluate some of their properties. List the results in the tables below:
Using the Algetec virtual laboratory, I performed the tensile test for the three materials described above, as shown below.
Below are the measurements of the specimens for each material:
A36 Steel
The A36 steel specimen was measured, and the following values were observed:
\[ D_0 = 5.25 \, \text{mm} \\ L_0 = 36.15 \, \text{mm} \]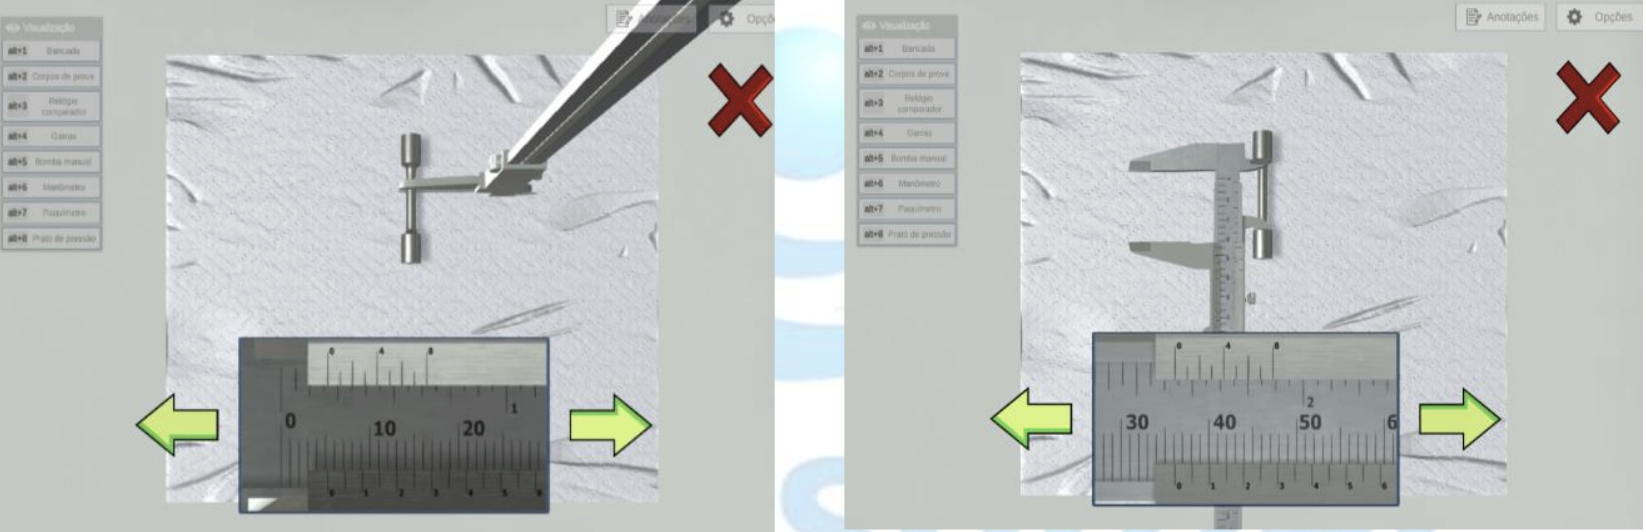
6AI-4V Steel
The 6AI-4V steel specimen was measured, and the following values were observed:
\[ D_0 = 5.50 \, \text{mm} \\ L_0 = 36.60 \, \text{mm} \]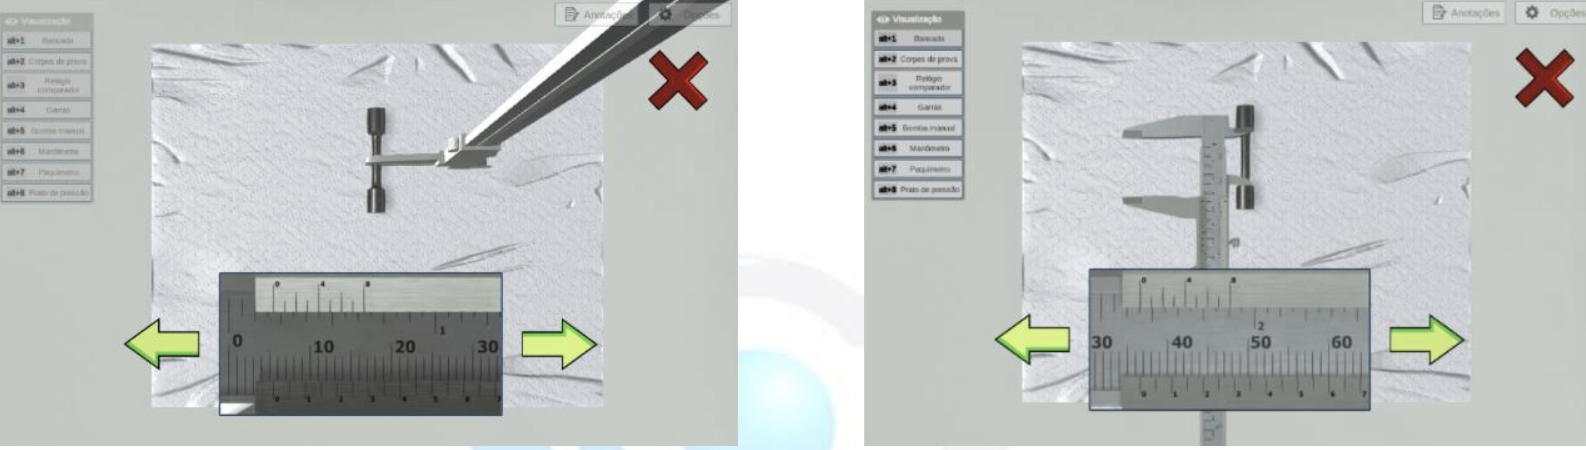
6061 Steel
The 6061 steel specimen was measured, and the following values were observed:
\[ D_0 = 5.20 \, \text{mm} \\ L_0 = 36.05 \, \text{mm} \]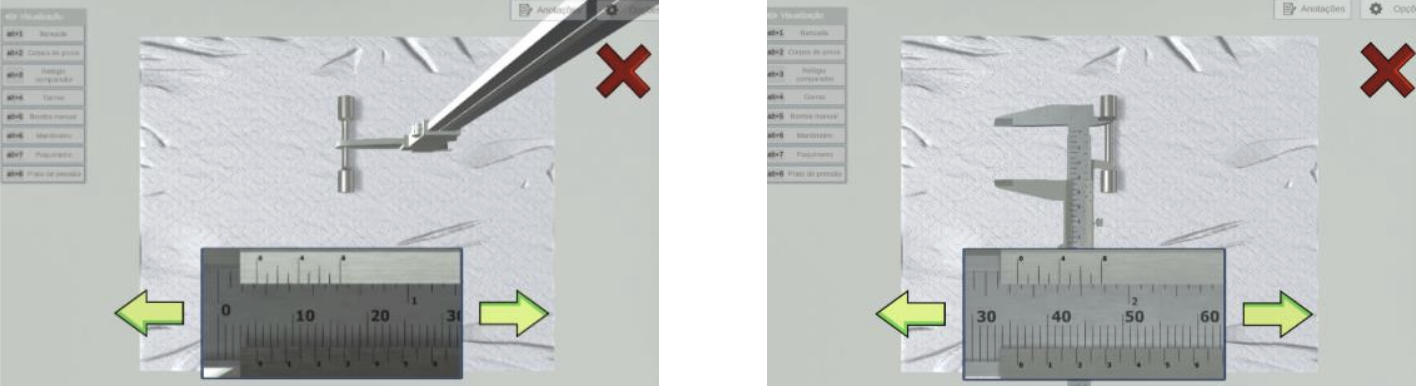
The following methodology was used to perform the test:
- The specimen was inserted into the machine and fixed in the grips, as shown below.
- Calibration of the dial indicator. This instrument measures the elongation of the specimen during the test.
- Activation of the manual pump to apply the load to the system and start the test. At each pump activation, the load and its corresponding elongation were recorded until rupture was achieved.
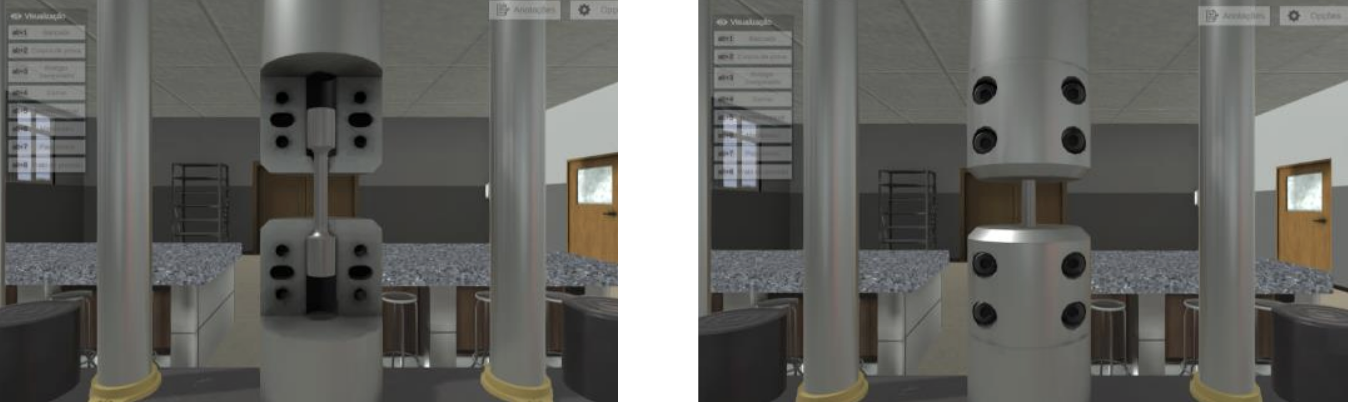
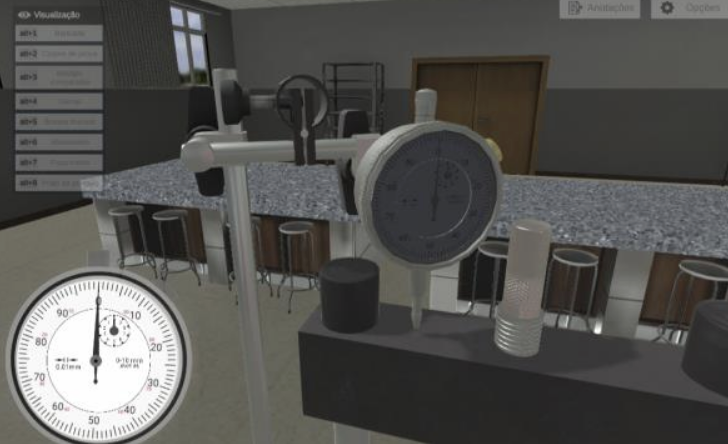
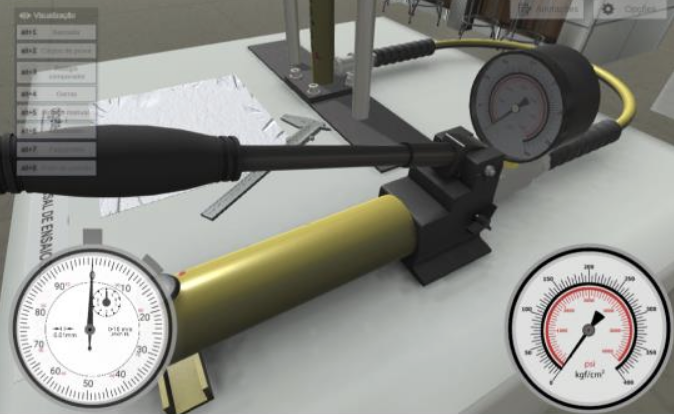
Note that a pre-load was applied to calibrate the system, and the dial indicator was reset to start the test.
| Sample | A36 | 6AI-4V | 6061 | |||
|---|---|---|---|---|---|---|
| L (mm) | 36.15 | 36.60 | 36.05 | |||
| Φ (mm) | 5.25 | 5.50 | 5.20 | |||
| Reading | ∆L (mm) | Load (kgf/cm²) | ∆L (mm) | Load (kgf/cm²) | ∆L (mm) | Load (kgf/cm²) |
| 1 | 0.435 | 0.450 | 0.450 | 19 | 0.010 | 10 |
| 2 | 0.450 | 0.480 | 0.480 | 55 | 0.019 | 17 |
| 3 | 0.458 | 0.510 | 0.510 | 85 | 0.019 | 19 |
| 4 | 0.470 | 0.550 | 0.550 | 125 | 0.022 | 23 |
| 5 | 0.800 | 0.570 | 0.570 | 145 | 0.030 | 33 |
| 6 | 0.980 | 0.590 | 0.590 | 165 | 0.040 | 39 |
| 7 | 1.160 | 0.610 | 0.610 | 189 | 0.045 | 45 |
| 8 | 1.340 | 0.635 | 0.635 | 210 | 0.050 | 52 |
| 9 | 1.52 | 0.66 | 0.66 | 230 | 0.06 | 60 |
| 10 | 1.7 | 0.71 | 0.71 | 270 | 0.07 | 65 |
| 11 | 1.89 | 0.74 | 0.74 | 283 | 0.08 | 73 |
| 12 | 2.07 | 0.755 | 0.755 | 291 | 0.09 | 85 |
| 13 | 2.24 | 0.78 | 0.78 | 300 | 0.092 | 91 |
| 14 | 2.425 | 0.82 | 0.82 | 310 | 0.1 | 93 |
| 15 | 2.61 | 0.82 | 0.82 | 311.000 | 0.13 | 93.000 |
| 16 | 2.79 | 0.88 | 0.88 | 313.000 | 0.13 | 95.000 |
| 17 | 3.15 | 1.01 | 1.01 | 314.000 | 0.18 | 98.000 |
| 18 | 3.7 | 1.115 | 1.115 | 315.000 | 0.35 | 100.000 |
| 19 | 4.42 | 1.26 | 1.26 | 316.000 | 0.53 | 102.000 |
| 20 | 4.6 | 1.465 | 1.465 | 316.000 | 0.72 | 103.000 |
| 21 | 4.79 | 1.71 | 1.71 | 317 | 0.91 | 104 |
| 22 | 4.98 | 1.98 | 1.98 | 318 | 1.09 | 105 |
| 23 | 5.15 | 2.32 | 2.32 | 319 | 1.26 | 106 |
| 24 | 5.33 | 2.70 | 2.70 | 319 | 1.44 | 106 |
| 25 | 5.51 | 3.11 | 3.11 | 320 | 1.63 | 107 |
| 26 | 4.8 | 4.8 | 321 | 1.81 | 106 | |
| 27 | 4.22 | 4.22 | 321 | 1.99 | 105 | |
| 28 | 4.48 | 4.48 | 321 | 2.17 | 104 | |
| 29 | 4.71 | 4.71 | 319 | 2.34 | 103 | |
| 30 | 5.07 | 5.07 | 315 | 2.53 | 102 | |
| 31 | 5.32 | 5.32 | 310 | 2.71 | 198 | |
| 32 | 5.75 | 5.75 | 295 | |||
| 33 | 5.84 | 5.84 | 292 | |||
| 34 | 5.90 | 5.90 | 287 | |||
| 35 | 5.95 | 5.95 | 283 | |||
| 36 | 5.97 | 5.97 | 279 | |||
| 37 | 5.99 | 5.99 | 275 | |||
| 38 | 6.01 | 6.01 | 270 | |||
| 39 | 6.02 | 6.02 | 265 | |||
| 40 | 6.03 | 6.03 | 262 | |||
Step 3
Based on the results obtained, determine the stress-strain curve for the three materials and discuss the evaluated properties and the behavior of each tested material.
When performing the experiment, it was observed that the pump load is given in kgf/cm². Thus, this value was multiplied by the piston area (6.5 cm²) to obtain the load in kgf. Then, this load was converted to Newtons using the relation:
\[ 1 \, \text{kgf} = 9.8067 \, \text{N} \]Finally, the tensile stress was calculated using the expression:
\[ \sigma = \frac{\text{Load (N)}}{\text{Cross-sectional area of the specimen (mm}^2)} \]Resulting in the following:
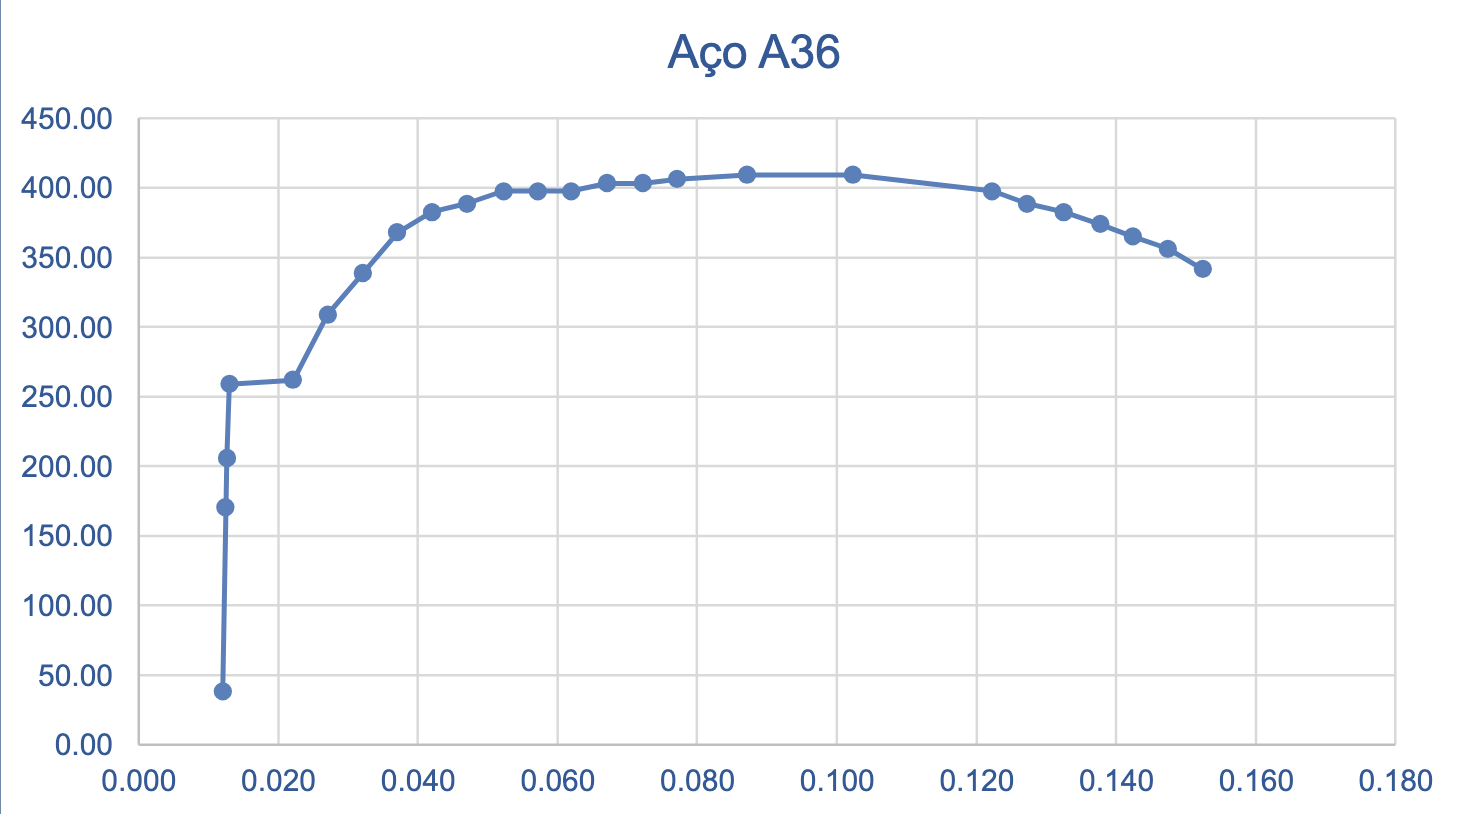
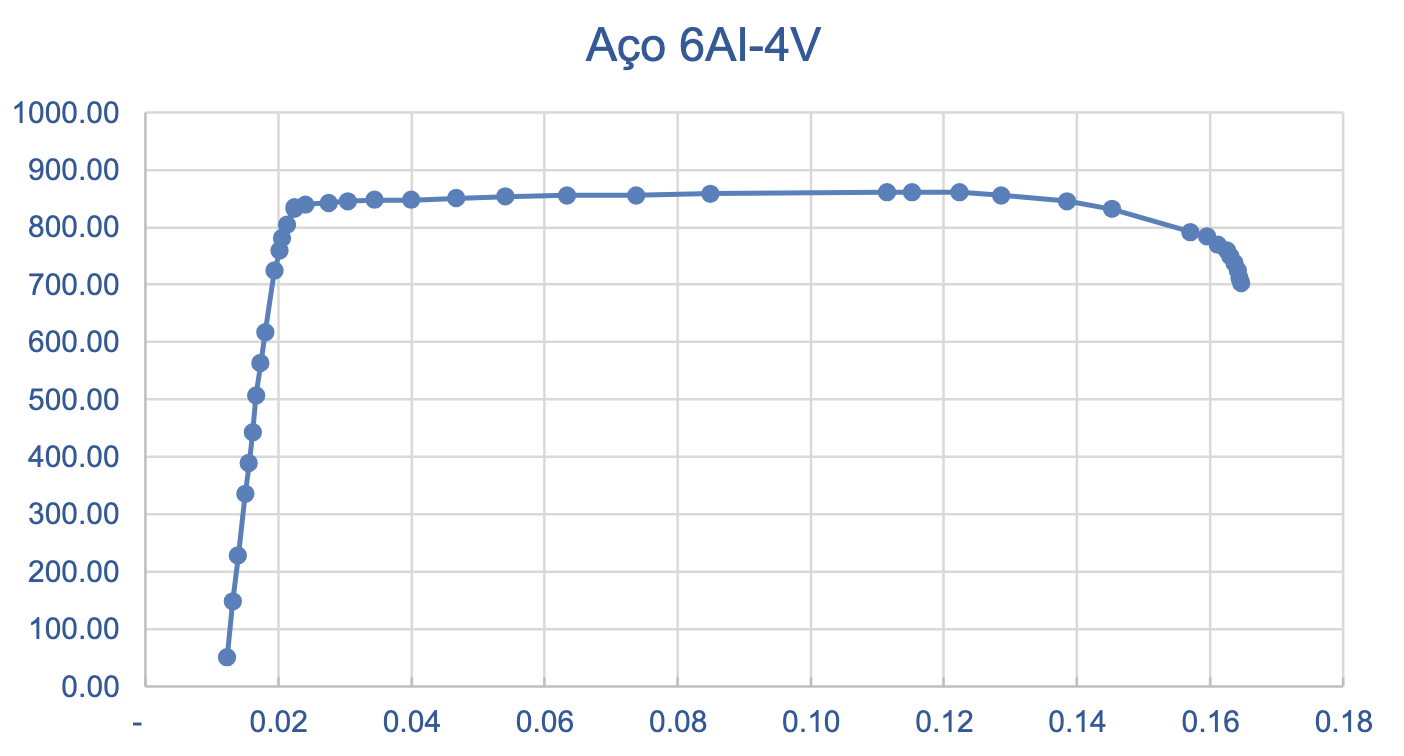
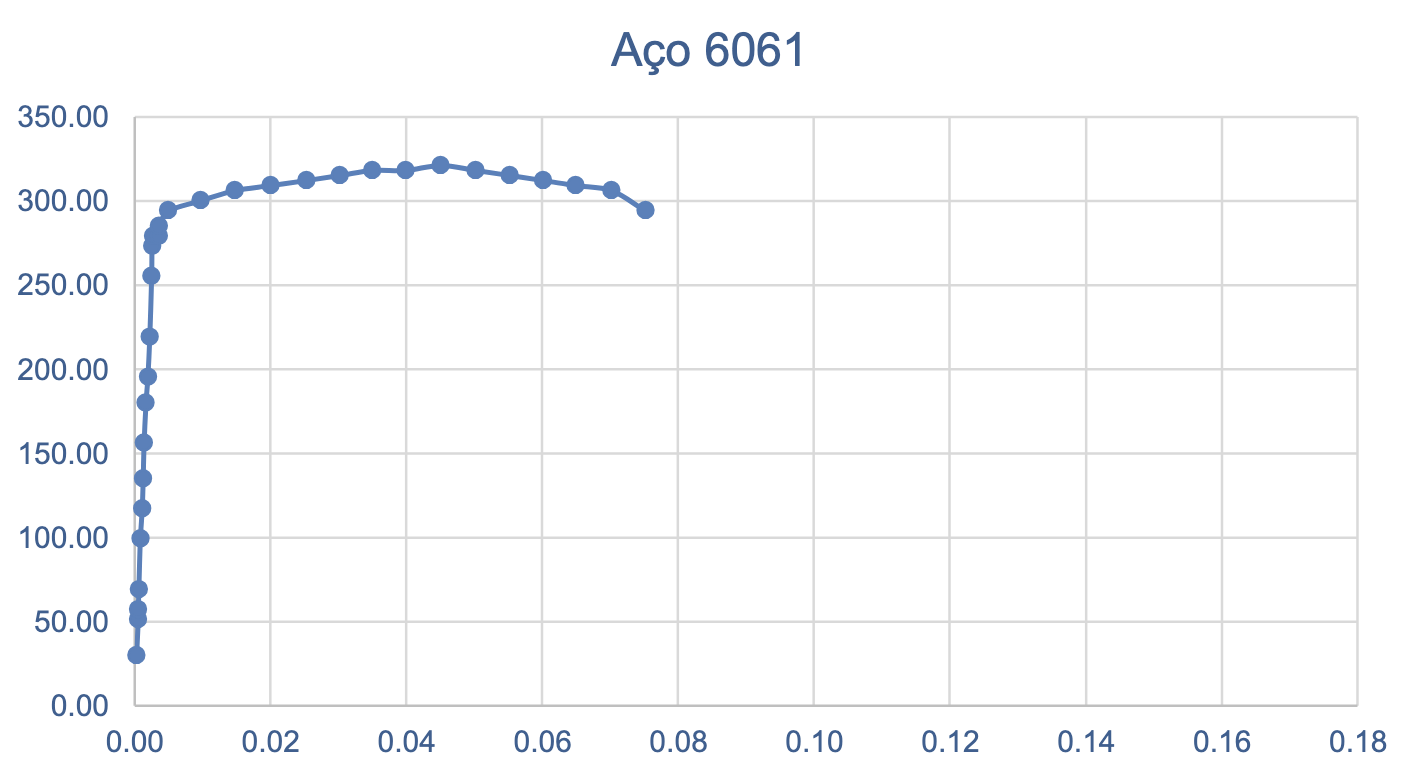
Analyzing the diagrams above, it can be concluded that the 6061 steel exhibits brittle behavior, as it does not undergo significant deformation before rupture. On the other hand, the A36 and 6AI-4V steels are ductile materials, deforming significantly before rupture.
Additionally, the rupture stress for each material can be identified:
\[ \sigma_{\text{rupture-A36}} = 341.57 \, \text{MPa} \\ \sigma_{\text{rupture-6AI-4V}} = 702.95 \, \text{MPa} \\ \sigma_{\text{rupture-6061}} = 294.15 \, \text{MPa} \]The 6AI-4V steel exhibited the highest value among the three materials.
The yield stress of the steels also showed distinct values:
\[ \sigma_{\text{yield-A36}} \approx 259 \, \text{MPa} \\ \sigma_{\text{yield-6AI-4V}} \approx 830 \, \text{MPa} \\ \sigma_{\text{yield-6061}} \approx 289 \, \text{MPa} \]Thus, it is concluded that the 6AI-4V steel has a more pronounced elastic zone, as yielding in this material begins at stresses around 830 MPa, while the other materials exhibit plastic behavior at stresses around 259 MPa and 289 MPa.
The experiment indicated that among the options, the 6AI-4V steel is the material that withstands the highest stresses. This statement can be proven by observing the ultimate stress values:
\[ \sigma_{\text{ultimate-A36}} = 409.30 \, \text{MPa} \\ \sigma_{\text{ultimate-6AI-4V}} = 861.24 \, \text{MPa} \\ \sigma_{\text{ultimate-6061}} = 321.16 \, \text{MPa} \]Analyzing the modulus of elasticity for each material, the following values were observed:
\[ E_{\text{A36}} = \frac{206.12 - 170.79}{0.012669 - 0.012448} = 159864.25 \, \text{MPa} \\ E_{\text{6AI-4V}} = \frac{563.43 - 507.09}{0.017350 - 0.016667} = 82489.02 \, \text{MPa} \\ E_{\text{6061}} = \frac{180.09 - 156.08}{0.001664 - 0.001387} = 86678.70 \, \text{MPa} \]Therefore, it is concluded that the A36 steel has the highest modulus of elasticity and, consequently, is the stiffest steel among all the materials studied.
Key Findings & Engineering Implications
Material Performance Analysis
- Ti-6Al-4V showed superior UTS: 861 MPa
- A36 steel exhibited highest modulus: 159.8 GPa
- Al-6061 demonstrated brittle fracture behavior
- 6Al-4V had 142% higher yield strength than A36
- Al-6061 showed 62% lower rupture stress vs Ti alloy
- Clear necking observed in steel specimens only
Structural Design Recommendations
- Ti-6Al-4V optimal for high-stress aerospace applications
- A36 steel suitable for stiffness-critical structures
- Al-6061 appropriate for non-critical lightweight components