Case Study Overview
Objective
This assignment explores the significant challenges faced in industrial maintenance today, with a particular focus on improving productivity, minimizing downtime, and managing resources efficiently in the chemical manufacturing sector. Through the case study, students will apply core maintenance principles to propose real-world solutions for operational issues such as workforce skills, equipment failure costs, and maintenance planning.
Challenge
Overcoming Plant A's chronic 45% NVA maintenance time while managing 5 critical compressors with 7 monthly failures. The solution required precise task classification (management vs operation), implementation of 52C1 hierarchical scheduling, and OEE optimization through downtime stratification. Key hurdles included coordinating 102 hours of monthly repairs, achieving 85% workforce VA targets, and integrating predictive maintenance strategies without disrupting 24/7 chemical production requirements. Success depended on balancing cost control with reliability improvements across 22 daily operational hours.
Context
According to ABECOM, the year 2023 begins with companies reevaluating their previous year's planning to seek and implement improvements that translate into increased productivity. In the view of its CEO, Rogério Rodrigues, there are industrial maintenance challenges that companies must face this year.

The eight challenges of industrial maintenance to overcome in 2023 are:
- Lack of qualified labor. The shortage of trained labor is a growing challenge in many countries. This is due to a series of factors, such as changes in market demand, the lack of training programs, and the withdrawal of experienced workers from the workforce. The lack of these professionals in the maintenance sector has a significant impact on companies, especially in the time required to train new talents until they can contribute to the overall equipment efficiency (OEE) and company productivity.
- Maintenance costs. Maintenance costs are not just the sum of the value of replacement parts and the hours worked by the team! Equipment failures cause production losses, delivery delays, and repair costs higher than expected. These should also be factored into the equation.
- Inventory management. “The main challenge we see in industries regarding MRO inventory management is the shift in mindset. Moving from reacting only when equipment breaks down to anticipating failures. Proactive Maintenance allows companies to better plan inventory levels and even eliminate the need for some components” (Rogério Rodrigues – CEO ABECOM).
- Maintenance planning. Building a PCM – Planning and Control of Maintenance is important for industries in many aspects. It minimizes equipment downtime, allows for timely intervention, better defines spare parts inventory levels, and maximizes productivity. However, there is a challenge to overcome: “In Brazil, we still have companies with the culture that the maintenance department only exists to fix and correct problems. This is a concept that must be combated. Industrial maintenance is responsible for the highest-value assets within a company. Moreover, machines and equipment, for the most part, require significant acquisition investments” (Rogério Rodrigues – CEO ABECOM).
- Integration with other company areas. Generally, industrial maintenance is integrated with production and engineering departments. However, there are other areas that can greatly benefit from the information collected by the maintenance department. A good example is the purchasing or Supply Chain department. They can use information about machine performance to define the purchase of a component in conjunction with the maintenance team. This will increase purchasing savings and save financial resources. The challenge for industries lies in the mistaken view of saving by buying the cheapest option. Savings should be measured based on cost-benefit. There are hidden costs at the time of purchase that only appear in the company's operational results, especially in maintenance costs. Therefore, the risk of buying the wrong item is very high.
- Risk management associated with maintenance. Rogério points out that identifying and managing risks associated with industrial equipment maintenance is not solely the responsibility of occupational safety. “A piece of equipment has risks that the maintenance department can anticipate and prevent. For this, it is necessary to collect data and monitor machine operation. Only then can companies make reliable decisions.” Can the equipment increase production levels? When should we stop for maintenance?
- Use of technology. “Industry 4.0 is no longer something for the future; it is the present. Companies that want to increase productivity, reliability, and equipment availability need to implement technology in maintenance activities. Especially with IoT solutions, monitoring, or data analysis tools. This may be a challenge, but once overcome, it brings many benefits” (Rogério Rodrigues – CEO ABECOM). The Internet of Things (IoT) allows the connection between devices, machines, and appliances. Moreover, when combined with predictive monitoring, it can detect changes in equipment operation and issue alerts for maintenance management to act before the problem worsens.
- Documentation management. Maintaining accurate and up-to-date documentation about equipment and maintenance activities is crucial to ensure maintenance efficiency and integrity. “[…] it is essential that companies adopt the practice of documenting maintenance activities. Not only for the Backlog but for decision-making and cause-and-effect analysis. Machine behavior, action history, and even maintenance indicators are very useful information to know when to act, what to replace, and why to replace it” (Rogério Rodrigues – CEO ABECOM).
Source: https://www.abecom.com.br/desafios-da-manutencao-industrial. Accessed on: May 21, 2023.
We know that the challenges are enormous, especially in the current post-pandemic scenario, with significant market instability and an ongoing war. These factors will require new actions from managers, both in production and maintenance.
As you may have noticed, maintenance has become an essential department within the organization and, more than that, a strategic one to overcome the challenges of our current scenario. The term maintenance is no longer associated with the activity of fixing something after identifying a problem, i.e., maintaining something, but with ensuring the good performance of machines, equipment, and processes at appropriate and competitive costs and, most importantly, safeguarding the lives and physical integrity of people.
Now that you have an overview of the importance of industrial maintenance, it is time to solve problems related to our case study by putting into practice many of the concepts covered in the discipline. With this objective, this M.A.P.A. will be divided into three phases. In each phase, you will be encouraged to implement tools and concepts worked on throughout the discipline to generate solutions that ensure the integrity of assets and people, as well as the good performance of industrial equipment and processes.
PHASE 1 – THE HUMAN FACTOR IN MAINTENANCE
Congratulations! You have landed your first job as a professional at a renowned company that operates in the production and sale of chemical products, a sector considered to be in full growth with investments of US$1.6 billion planned for the period 2021 to 2024, according to Abiquim (Brazilian Chemical Industry Association). Additionally, at an event held in December 2021, the president of Abiquim, João Parolin, pointed out that the moment is favorable for expanding the sector's capacity.
Due to this great market opportunity, aligned with the expectation of GDP growth, the unit manager calls the team for a meeting and presents the new strategic planning of the company, as well as the challenges and expected results for the period 2023 to 2025. Your department, responsible for the unit's maintenance, must develop a work plan focused on the following five principles: cost control, production maximization, workforce optimization, continuous improvement, and higher product quality.
Thus, new activities, meetings, and demands begin for the maintenance department with the objective of preparing and fulfilling the new requested plan, which is aligned with the company's new strategic planning. The next day, you are called to a meeting, and the main topic is the low reliability of Plant A, which has generated high maintenance costs and has the worst failure rate in the unit, directly contributing to low production. Right from the start, you identify a great opportunity regarding the work performed by the maintenance team, as well as the organization of roles and responsibilities in this department.
Source: https://www.quimica.com.br/industria-quimica-oportunidade-para-atrair-investimentos-ao-setor/. Accessed on: May 21, 2023, at 14:30.
1.a. Organizing Maintenance Activities
It is necessary to organize activities to ensure that maintenance occurs in a structured and planned manner, i.e., it is necessary to start working to move away from the condition of "putting out fires" all the time. Based on the literature and good maintenance practices, you prepare a list of ten tasks that are routinely performed by the maintenance team:
- Daily allocation of maintenance resources.
- Weekly service planning meetings with the production department.
- Implement actions to reduce costs and improve maintenance indicators.
- Perform maintenance activities safely and following good practices.
- Seek and implement new technologies that improve equipment performance.
- Identify the root cause of failures and propose actions to mitigate future occurrences.
- Monitor maintenance indicators, especially the percentage of compliance with the maintenance plan, and take appropriate measures when necessary.
- Provide special resources for maintenance (parts, consumables, and special tools).
- Supervise maintenance services and provide technical support to maintenance personnel.
- Achieve at least 85% of worked hours converted into added value, increasing the utilization rate of maintenance teams.
Using the following table model, classify the ten tasks presented according to the main principle behind each one, i.e., MANAGEMENT or OPERATION. Remember that tasks classified as management aim to achieve goals and improve indicators, while tasks classified as operation refer to daily operational activities, i.e., those of the day-to-day maintenance.
| Class | Task |
|---|---|
| Operation | |
| Management |
| Class | Task |
|---|---|
| Operation |
|
| Management |
|
1.b. Training for Maintenance Planners and Schedulers
You identify that there is no separation of planning and scheduling tasks, i.e., people end up performing the same tasks, sometimes even redundantly. To improve maintenance management, you propose training for maintenance planners and schedulers. For this, it is first necessary to organize the tasks:
- Manage maintenance plans.
- Use criteria to prioritize emergency services.
- Define maintenance strategies for each type of equipment.
- Monitor daily the availability and utilization of human resources in maintenance.
- Coordinate and provide the correct treatment for inspections.
- Coordinate materials and other resources needed for maintenance.
- Schedule maintenance shutdowns.
- Keep maintenance indicators updated.
- Manage maintenance records.
- Schedule maintenance services, defining the executors and the date of execution.
Using the following table model, classify the ten tasks presented according to the responsible function, with five for scheduling and five for planning.
| Function | Task |
|---|---|
| Planning | |
| Scheduling |
| Function | Task |
|---|---|
| Planning |
|
| Scheduling |
|
1.c. Prioritizing Actions to Reduce Non-Value-Added Time
Evaluating the maintenance productivity numbers on a daily basis, you arrived at the values shown in the following figure:
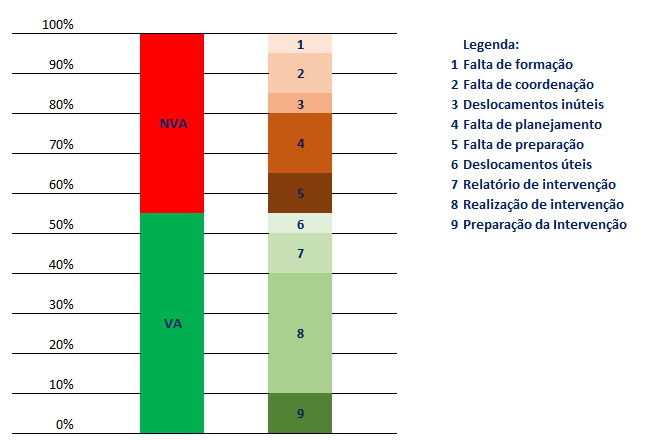
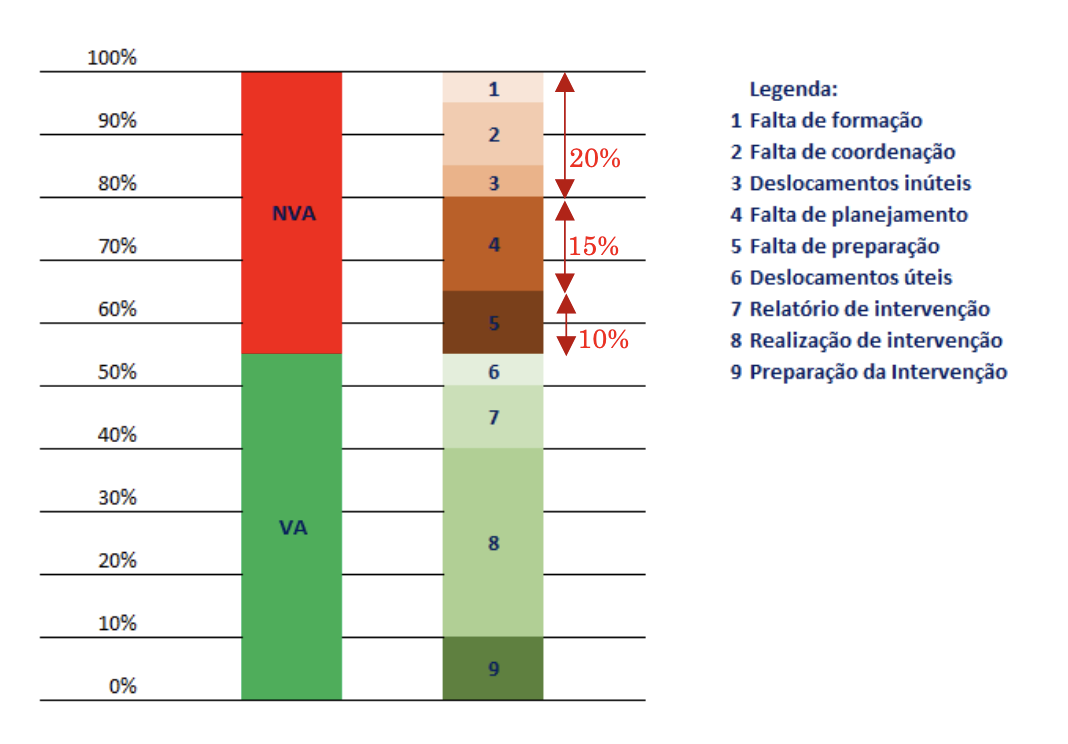
Considering that the global VA (Value Added) target is 85%, what are the five priority actions you would list to reduce the % of NVA (Non-Value Added) causes shown in the previous figure?
The company's goal is to achieve a global target of 85% VA (Value Added) in maintenance. Currently, this value is around 55%. Some suggestions for improving this value include eliminating the causes of NVA. Possible actions that can contribute to this elimination are:
To Eliminate Lack of Training (5% of NVA Activities):
- Develop a continuous training programme that addresses the skills and knowledge required for the roles.
- Identify skill gaps and guide training based on regular performance evaluations.
- Hire external consultants or specialists to provide specialised training when necessary.
To Eliminate Lack of Coordination (10% of NVA):
- Hold regular meetings with the team to discuss ongoing projects, exchange information, and resolve coordination issues.
- Create a project management tool to help identify conflicts and track team progress.
- Appoint a project coordinator or team leader to oversee team coordination.
To Address Useless Travel (5% of NVA):
- Reorganise the workplace to reduce the need for travel.
- Store materials and tools near the work area.
- Use a walkie-talkie system to request materials and tools.
To Address Lack of Planning (15% of NVA):
- Include clear goals and deadlines for each maintenance project.
- Appoint a maintenance planner to create a comprehensive schedule of all activities, including contingencies.
- Conduct early risk analyses to identify potential problems and create solutions.
To Address Lack of Preparation (10% of NVA):
- Create standards for preparing tools and materials before each maintenance task.
- Develop a checklist to ensure all necessary items are available and in good condition.
- Educate employees on the importance of preparation and how it can improve work efficiency.
1.d. Calculating the New Value Added (VA) Percentage
After implementing the actions suggested by you, the causes of NVA (Non-Value Added) 1, 2, 3, and 5 were reduced by 25%, and action number 4 showed a 30% improvement. Under these conditions, what is the new final VA (Value Added) value after implementing the actions? (Use two decimal places in the calculation).
Before implementing the improvement actions, the causes of NVA 1, 2, 3, and 5 represented a total of 30%, and cause 4 represented 15%.
Thus, following the reductions stated in the problem:
Reduction of Causes 1, 2, 3, and 5 by 25%:
\( (1 - 0.25) \times 30\% = 0.75 \times 30\% = 22.50\% \)
Reduction of Cause 4 by 30%:
\( (1 - 0.3) \times 15\% = 0.7 \times 15\% = 10.50\% \)
Total NVA After Reductions:
\( 22.50\% + 10.50\% = 33.00\% \)
Final VA Value:
\( VA = 100\% - 33\% = 67.00\% \)
PHASE 2 – MAINTENANCE PLAN
You are doing an excellent job, helping to lead the maintenance process with great care! And everyone notices that the results are improving. However, something bothers you: how to maximize production with so many breakdowns that still occur? And remembering that the fourth challenge presented by ABECOM is related to maintenance planning, you decide to select five pieces of equipment from Plant A for criticality analysis and the creation of a maintenance plan. Based on process data and interviews, you manage to compile the following information:
| Equipment | Description |
|---|---|
| 1 – Air Compressor | This equipment is required for 8 to 10 hours/day. Its history shows an average of 7 failures per month, with an impact that extends beyond the equipment, i.e., it causes production stoppages due to a lack of compressed air for equipment with many pneumatic actuators. The average repair time is 2 to 4 hours, with relatively high failure costs (due to stopping the production process for more than 3 hours), and the equipment does not affect safety, the environment, or quality. |
| 2 – Steam Control Valve | This equipment is required 24 hours/day. Its history shows an average of 2 failures per year (usually due to steam leakage in seals), but with a stoppage of the entire process. The repair time is 2 to 3 hours, with a cost of less than R$800.00, and the equipment poses a medium safety risk due to steam but does not affect the environment or quality. |
| 3 – Filter | This equipment is required 16 hours/day. Its history shows an average of 3 failures per year, with an impact that can cause stoppages of up to 1.5 hours in the process due to equipment redundancy. The average repair time is 2.5 hours, with a cost of less than R$2,000.00, and the equipment does not affect safety or quality. However, it has a moderate environmental impact, potentially leading to internal complaints. |
| 4 – Process Pump | This equipment is required 24 hours/day. Its history shows an average of 2 failures per semester, with an impact that affects the entire process, causing stoppages of more than 2 hours. The repair time is 2 to 3 hours, with an average cost of R$1,500.00, and the equipment does not affect quality, safety, or the environment. |
| 5 – Heat Exchanger | This equipment is required 12 hours/day. Its history shows an average of 2 failures per year, with an impact that affects part of the process. It does not cause process unavailability but results in partial production losses. The repair time is less than 2 hours, with an average cost of R$1,700.00. The equipment does not affect safety or the environment but severely affects product quality, leading to internal complaints. |
2.a. Equipment Criticality Classification
Use the following algorithm and classify the criticality of these equipment as A, B, and C:
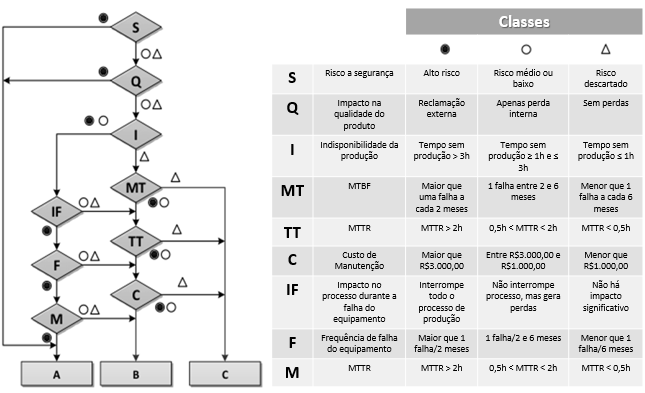
The table below makes the visualization of the classification easier:
| Criteria | Air Compressor | Steam Control Valve | Filter | Process Pump | Heat Exchanger |
|---|---|---|---|---|---|
| S | ∆ | ○ | ∆ | ∆ | ∆ |
| Q | ∆ | ∆ | ∆ | ∆ | ● |
| I | ● | ● | ○ | ○ | - |
| MT | - | - | ○ | - | - |
| IF | ● | ● | ● | ● | - |
| TT | - | - | - | - | - |
| C | - | ∆ | ○ | ○ | - |
| F | ● | ○ | ○ | ○ | - |
| M | ● | - | - | - | - |
| Classification | A | C | C | C | A |
2.b. Maintenance Schedule for the Air Compressor
The high criticality of the air compressor stands out, as it can stop the entire Plant A in case of failure! You then seek information about the compressor and obtain the schematic drawing as well as the activities that must be performed:
Considering the activities and their respective frequencies, and the non-hierarchical plan, starting with annual maintenance in week 1, create the 52-week map (52C1) for this compressor. The times required for each type of maintenance are:
- A and B: 2 hours with 1 maintenance worker.
- C and D: 3 hours with 2 maintenance workers.
Considering the data presented, here is the 52C1 plan without hierarchy:

2.c. Maintenance Schedule for 5 Compressors
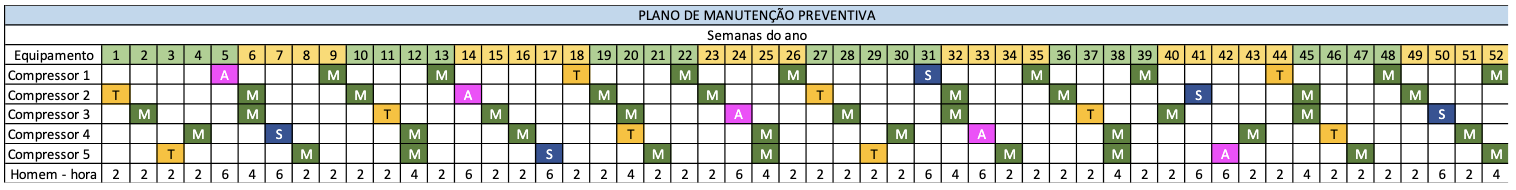
Knowing that the industrial complex has 5 compressors of this model, what would a single 52-week map (52C1) look like for the 5 equipment, considering a hierarchical plan? Oh, one detail, for budgetary reasons, your manager informed that semi-annual and annual maintenance needs to be "spread out" throughout the year, starting in week 5 with a 2-month difference between each compressor, i.e., compressor 1 in week 5, compressor 2 in week 15, compressor 3 in week 24, and so on.
For a more homogeneous distribution of working hours each week, the maintenance weeks were adjusted. Below is the 52-week map for the five compressors considering the plan with hierarchy. Note that a two-month interval between the annual maintenance of each compressor was respected.
2.d. Total Maintenance Hours for 5 Compressors
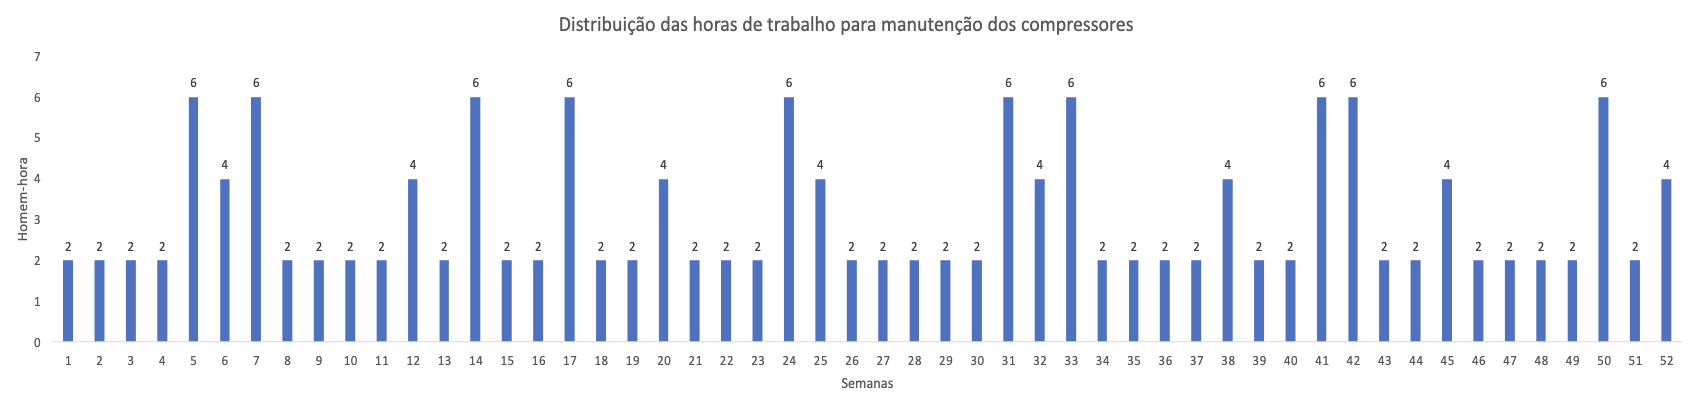
Based on your 52-week map (52C1), what is the total man-hours (Hh) committed to preventive maintenance for the 5 compressors during the year?
According to the analysis of the map above, it is concluded that 160 man-hours will be required for the implementation of the maintenance plan:

To make it easier to visualise the distribution of these hours throughout the year, the same information is presented below in a bar chart:
PHASE 3 – MAINTENANCE INDICATORS
Great job, you are doing well in your work, but it is necessary to demonstrate this in a consistent and structured way. Your manager asks: how? And you promptly respond: through maintenance and reliability indicators!
3.a. Classifying Value-Added and Non-Value-Added Activities
Evaluating the maintenance productivity numbers for the last week of a team of 5 people, you arrived at the values shown in the following table:
| Activity Type | Time (hours) | Classification (VA/NVA) |
|---|---|---|
| Planning Failures | 20:00 | ? |
| Useful Travel | 20:00 | ? |
| Useless Travel | 30:00 | ? |
| Filling Out Work Orders | 20:00 | ? |
| Lack of Preparation | 20:00 | ? |
| Service Execution | 110:00 | ? |
Considering the concepts of VA (Value Added) and NVA (Non-Value Added), classify the activities as VA and NVA by filling in the field in the table. Calculate the percentage of VA and NVA based on the data for each type of event to use these numbers in your next meeting with the maintenance team.
Calculation of Value Added (VA) and Non-Value Added (NVA) Percentages
First, we sum up all the hours spent on maintenance (M):
\( M = 20 + 20 + 30 + 20 + 20 + 110 = 220 \, \text{hours} \)
From these hours, we calculate the value-added hours (MA) and the non-value-added hours (MD):
\( MA = 20 + 20 + 110 = 150 \, \text{hours} \)
\( MD = 220 - 150 = 70 \, \text{hours} \)
Therefore, to calculate the percentage of value-added and non-value-added hours, we use the values above:
\( VA\% = \frac{150}{220} \times 100 = 68.18\% \)
\( NVA\% = \frac{70}{220} \times 100 = 31.82\% \)
3.b. Calculating OEE for MBBS-355 Machine
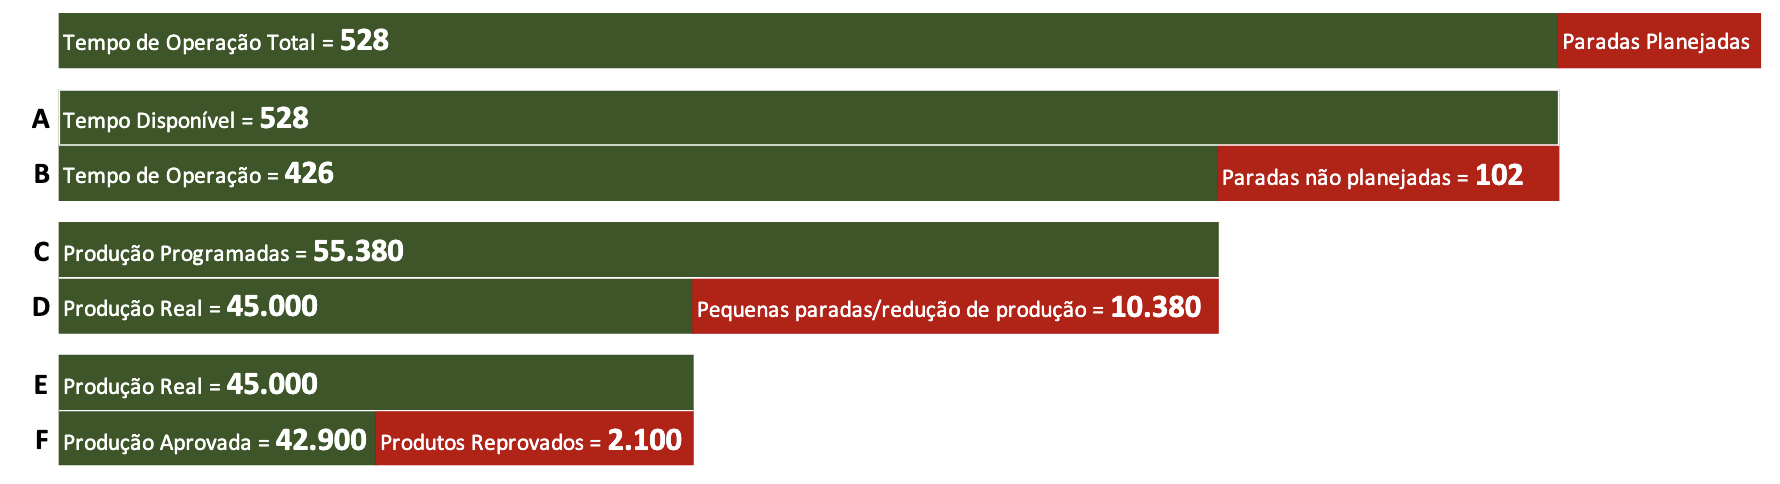
Last month, one of the plant's machines, the MBBS-355, known as the bottleneck machine (due to its significant impact on the process), contributed greatly to reducing the plant's performance. This equipment should have operated 24 hours/day for 22 days in the month in question. However, it experienced 14 failures during the period, totaling 102 hours of downtime in the month. The cycle time of this machine is 130 units per hour, and in the month, its production was 45,000 units, but only 42,900 were approved. Under these conditions, what was the OEE of the MBBS-355 machine?
Calculation of OEE (Overall Equipment Effectiveness)
Calculating the availability index:
\( D = \frac{\text{Operating Time}}{\text{Total Time}} = \frac{426}{528} = 0.807 \)
Calculating the performance index:
\( P = \frac{\text{Actual Production}}{\text{Planned Production}} = \frac{45,000}{55,380} = 0.81256 \)
Calculating the quality index:
\( Q = \frac{\text{Approved Production}}{\text{Actual Production}} = \frac{42,900}{45,000} = 0.953 \)
Calculating the OEE:
\( OEE = D \times P \times Q = (0.807 \times 0.81256 \times 0.953) \times 100 = 62.5\% \)
3.c. Stratifying Downtime for MBBS-355 Machine
By stratifying the downtime, you arrived at the following table:
| Failure Type | Time | Cause |
|---|---|---|
| Mechanical | 9:00 | Drive belt failure |
| Mechanical | 12:00 | Drive shaft failure |
| Electrical | 7:00 | Frequency inverter failure |
| Mechanical | 8:00 | Articulation system failure |
| Instrumentation | 3:30 | Communication cable break |
| Mechanical | 4:00 | Drive shaft failure |
| Electrical | 3:00 | Contactor burnout |
| Mechanical | 12:30 | Bearing failure |
| Mechanical | 9:00 | Oil seal leakage |
| Electrical | 3:00 | Short circuit in power cables |
| Mechanical | 12:00 | Coupling failure |
| Instrumentation | 3:30 | Sensor burnout |
| Instrumentation | 5:30 | Pneumatic cylinder failure |
| Electrical | 10:00 | Servo motor burnout |
Considering the 14 failures of the MBBS-355 machine during the 22 days of operation, as well as the data from the stratification of these downtimes shown in the previous table, what was the Mean Time Between Failures (MTBF), the Mean Time to Repair (MTTR), and the Inherent Availability of this machine during the period?
Calculation of MTBF, MTTR, and Inherent Availability
Analysing the table above, we note the following:
Total downtime:
\( \sum t = 9 + 12 + 7 + 8 + 3.5 + 4 + 3 + 12.5 + 9 + 3 + 12.5 + 9 + 3 + 12 + 3.5 + 5.5 + 10 = 102 \, \text{hours} \)
Total operating time:
\( \sum T = \text{Total Time} - \sum t = 22 \times 24 - 102 = 528 - 102 = 426 \, \text{hours} \)
Calculating MTBF (Mean Time Between Failures):
\( MTBF = \frac{\sum T}{N} = \frac{426}{14} = 30.429 \)
Calculating MTTR (Mean Time to Repair):
\( MTTR = \frac{\sum t}{N} = \frac{102}{14} = 7.286 \)
Calculating Inherent Availability:
\( \text{Availability} = \frac{MTBF}{MTBF + MTTR} = \frac{30.429}{30.429 + 7.286} = 0.807 \)
3.d. Calculating OEE After Improvements
With the advancement of the planned maintenance pillar and the creation of more robust maintenance plans, the following month saw a 40% reduction in mechanical downtime, a 30% reduction in electrical downtime, and a 12% reduction in instrumentation downtime (consider the data from the previous table – 3.c.). With this improvement, the number of units produced in the month was 48,000, and only 820 were rejected. What was the OEE for this month after implementing the improvements?
Calculation of OEE After Improvements
Calculating the time for mechanical downtimes:
The total time for mechanical downtimes was reduced by 40%. Therefore, the new value is:
\( \text{MD} = (1 - 0.4) \times (9 + 12 + 8 + 4 + 12.5 + 9 + 12) = 0.6 \times 66.5 = 39.9 \, \text{hours} \)
Calculating the time for electrical downtimes:
The total time for electrical downtimes was reduced by 30%. Therefore, the new value is:
\( \text{ED} = (1 - 0.3) \times (7 + 3 + 3 + 10) = 0.7 \times 23 = 16.1 \, \text{hours} \)
Calculating the time for instrumentation downtimes:
The total time for instrumentation downtimes was reduced by 12%. Therefore, the new value is:
\( \text{ID} = (1 - 0.12) \times (3.5 + 3.5 + 5.5) = 0.88 \times 12.5 = 11 \, \text{hours} \)
Calculating the total downtime:
\( \text{Total Downtime} = 39.9 + 16.1 + 11 = 67 \, \text{hours} \)
Calculating the availability index:
\( D = \frac{\text{Operating Time}}{\text{Total Time}} = \frac{461}{528} = 0.87311 \)
Calculating the performance index:
\( P = \frac{\text{Actual Production}}{\text{Planned Production}} = \frac{48,000}{130 \times 461} = \frac{48,000}{59,930} = 0.80093 \)
Calculating the quality index:
\( Q = \frac{\text{Approved Production}}{\text{Actual Production}} = \frac{48,000 - 820}{48,000} = \frac{47,180}{48,000} = 0.98292 \)
Calculating the new OEE:
\( OEE = D \times P \times Q = 0.87311 \times 0.80093 \times 0.98292 = 0.68736 \)
\( OEE = 68.736\% \)
3.e. Reducing Failure Rate and Increasing Operational Time
To reduce the failure rate of the MBBS-355 machine by 20%, while increasing the operating time of 426 hours by 8%, the number of failures during the next 22 days of operation should be reduced from 14 to what value?
3.e. Calculation of Reduced Failure Rate
It is known that:
\( MTBF = 30.429 \)
Therefore, the current failure rate is:
\( MTBF = \frac{1}{\text{Failure Rate}} \)
\( 30.429 = \frac{1}{\text{Failure Rate}} \)
\( \text{Failure Rate} = \frac{1}{30.429} = 0.032863 \)
To reduce it by 20%, the new failure rate will be:
\( \text{Failure Rate} = (1 - 0.2) \times 0.032863 = 0.8 \times 0.032863 = 0.0262904 \)
Thus, the new MTBF is:
\( MTBF = \frac{1}{\text{Failure Rate}} = \frac{1}{0.0262904} = 38.037 \)
Therefore, considering an 8% increase in the operating time of 426 hours, the number of failures should be:
\( MTBF = \frac{\text{Operating Hours}}{\text{Number of Failures}} \)
\( 38.037 = \frac{426 \times 1.08}{\text{Number of Failures}} \)
\( 38.037 = \frac{460.08}{\text{Number of Failures}} \)
\( \text{Number of Failures} = \frac{460.08}{38.037} = 12.096 \)
\( \text{Number of Failures} = 12 \, \text{failures} \)
Implementation Outcomes
System Performance Achievements
- 67% Value Added (VA) efficiency achieved post-NVA reduction actions
- 160 total man-hours optimized for 5 compressor PM schedules
- 85% maintenance plan compliance rate established
- 68.74% OEE improvement after mechanical/electrical downtime reductions
- 30.4-hour MTBF achieved for critical bottleneck equipment
- 40% reduction in mechanical failure recurrence rates
Technical Validation
The maintenance optimization program demonstrated:
- Effective criticality classification (ABC methodology)
- Robust 52-week hierarchical scheduling for 5 compressors
- Accurate NVA/VA differentiation across 220 analyzed work hours